Project 09 · CE 502
Construction Accounting, Finance & Strategy
CE 502 · Construction Accounting, Finance & Strategy · University of Southern California · 2024–2025
Course
CE 502 — Construction Accounting, Finance & Strategy
Projects
3 — LEGO, Skanska, Nava Bharat
Tools
Excel, PowerPoint, Financial Modeling
Focus
Corporate Finance, Strategy, Project Finance
Contents
Course Overview
CE 502 is a graduate-level course covering the financial and strategic dimensions of construction and engineering firms. Topics span corporate accounting, financial statement analysis, project finance structures, capital budgeting, and competitive strategy within the construction industry. Work in this course required both quantitative financial modeling in Excel and written strategic analysis through team presentations and research papers.
The three major deliverables covered here are: a failure analysis of LEGO examining how the company nearly went bankrupt in 2003–2004 and the financial ratios behind its recovery; a term paper on Skanska, a global construction giant, analyzing its industry position, financials, strategy, and competitive outlook; and a project finance case study on Nava Bharat Energy India Limited (NBEIL), a coal-fired power plant SPV, involving DSCR and IRR calculations, waterfall analysis, and a full sensitivity analysis built in Excel.
Project 1
Team Presentation · CE 502
LEGO — Financial Failure Analysis & Turnaround
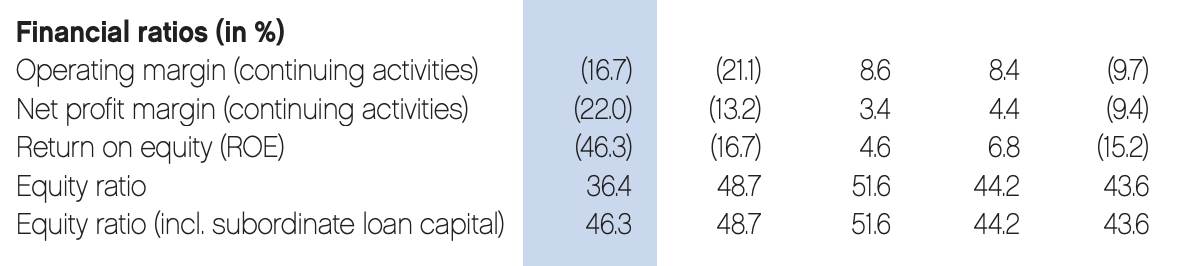
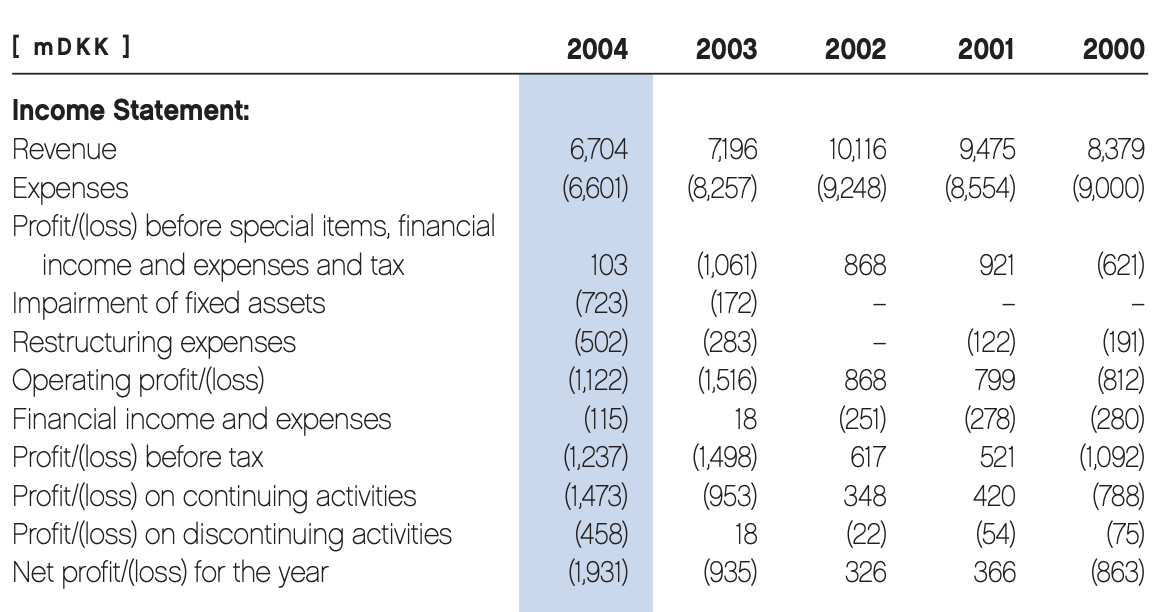
This team presentation analyzed LEGO's near-bankruptcy in 2003–2004 and its remarkable financial recovery. At its lowest point, LEGO posted a net loss of 1.07 billion DKK with an operating margin of –16.7% and a return on equity of –46.3%. The analysis traced the collapse to overexpansion into non-core businesses, bloated product lines, and loss of brand focus — and then examined the strategic decisions that turned the company around.
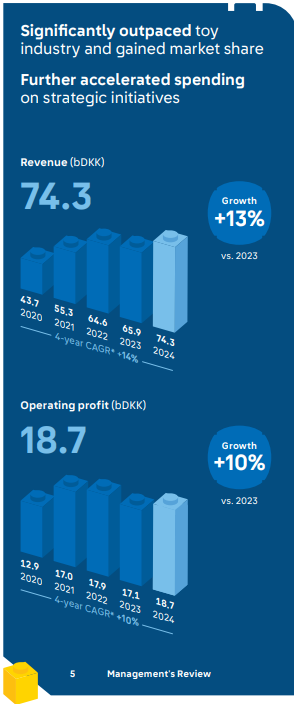
The recovery was driven by aggressive cost cutting, a refocus on the core brick product, licensing deals (Star Wars, Harry Potter), and digital expansion. From 1998 to 2023, LEGO grew revenue and EBIT at a 9% CAGR — reaching DKK 74.3 billion in revenue and DKK 18.7 billion in operating profit in the most recent reported period, a +13% growth year-over-year. The analysis used income statements, financial ratio tables, and multi-year trend charts to quantify each phase.
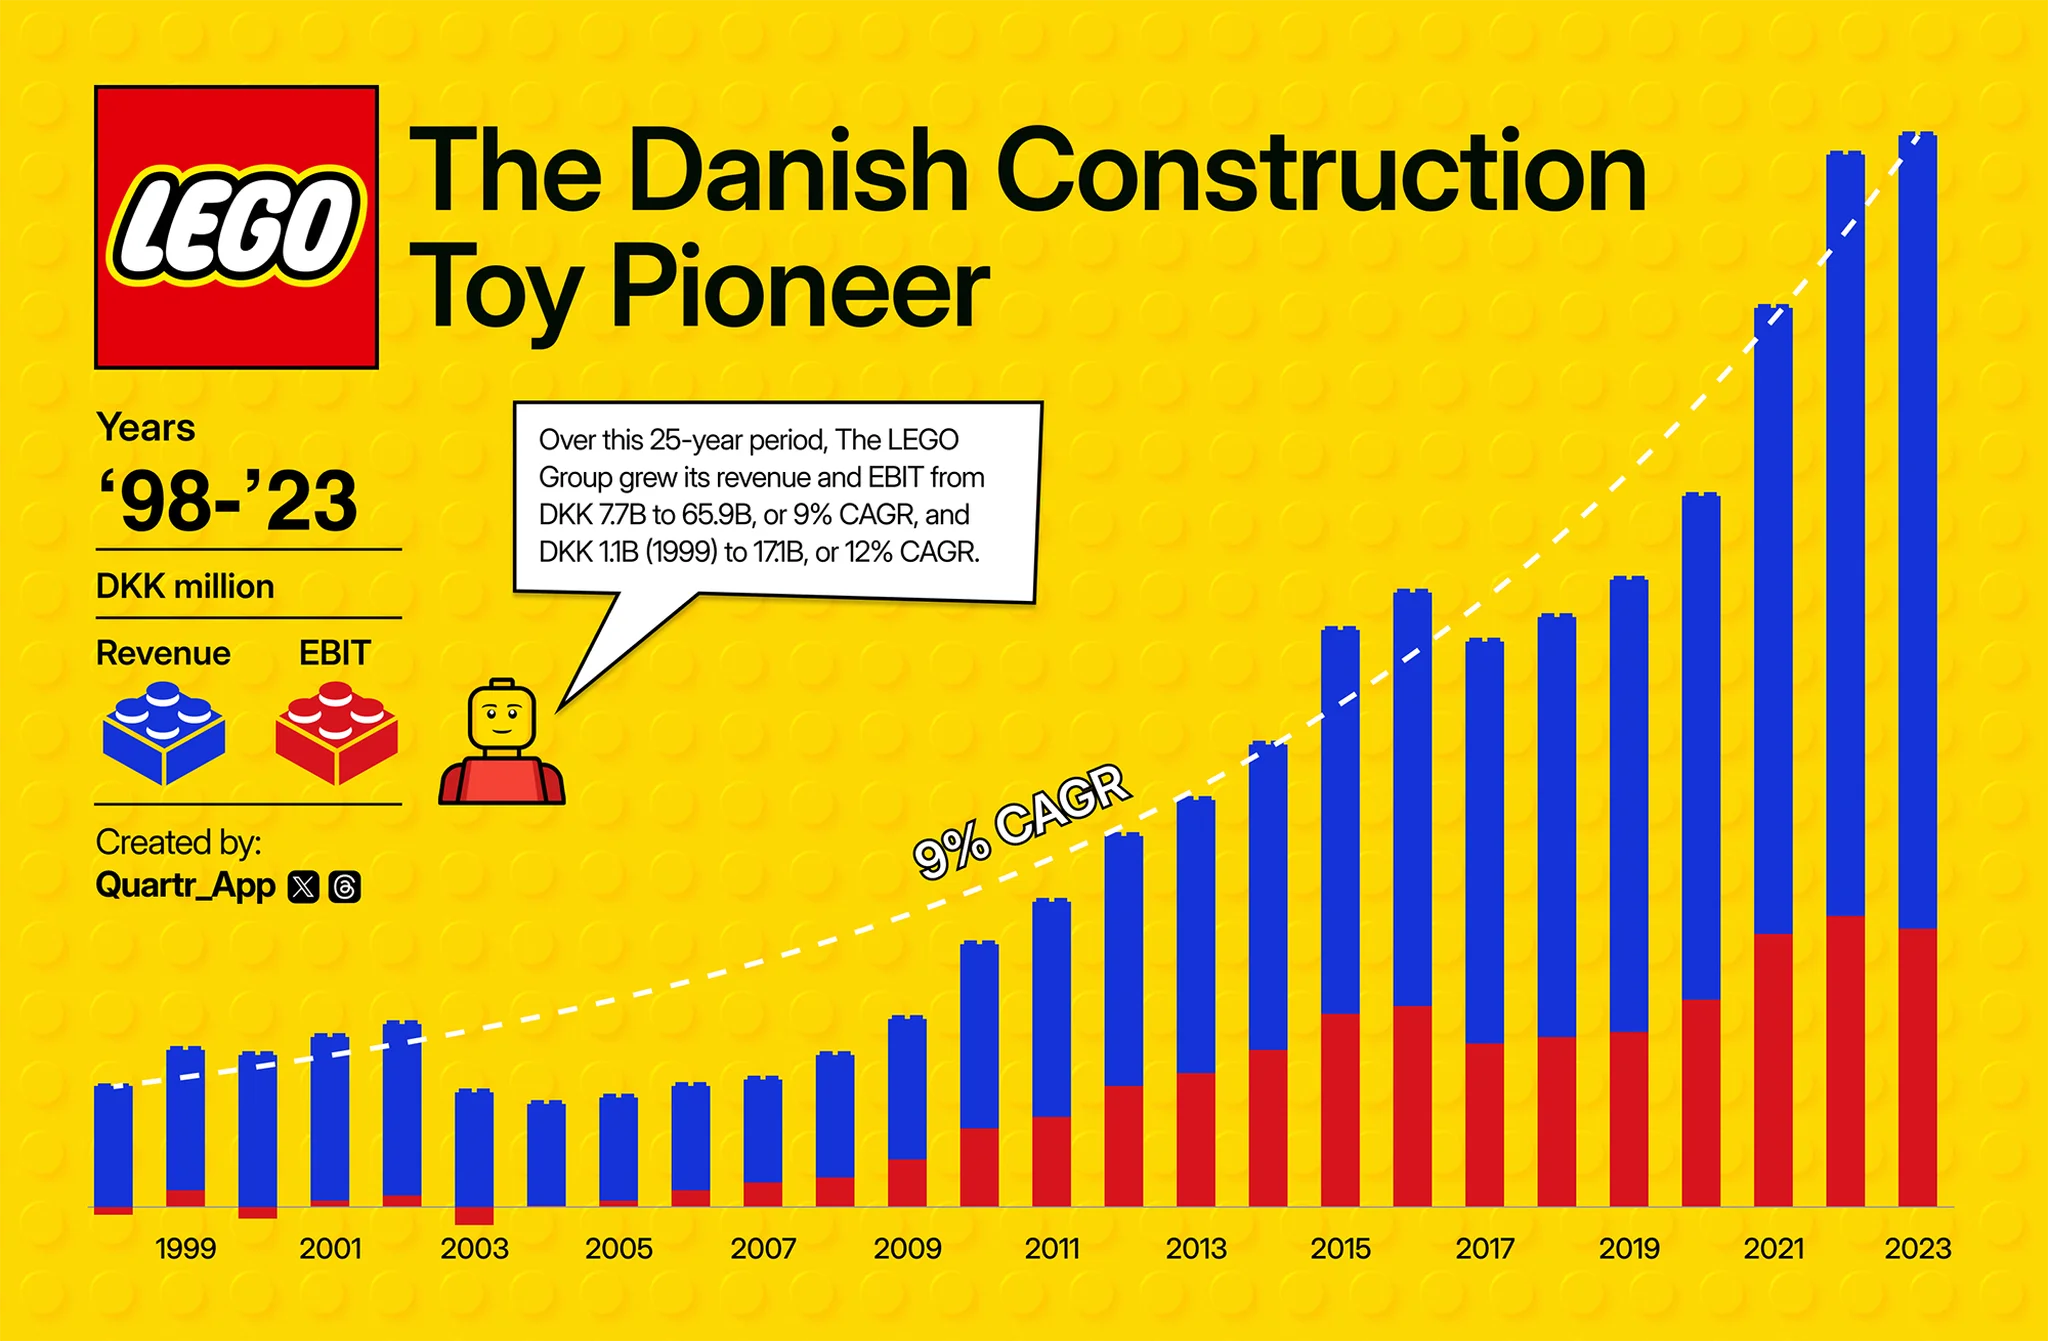
LEGO financial data — income statements, ratio analysis, and 25-year revenue/EBIT trend · Click to enlarge
LEGO Failure Analysis — Team Presentation
CE 502 · Team 2 · Full slide deck with financial statements, ratio analysis, and turnaround strategy
Project 2
Term Paper & Presentation · CE 502
Skanska — Strategic & Financial Analysis of a Global Construction Firm
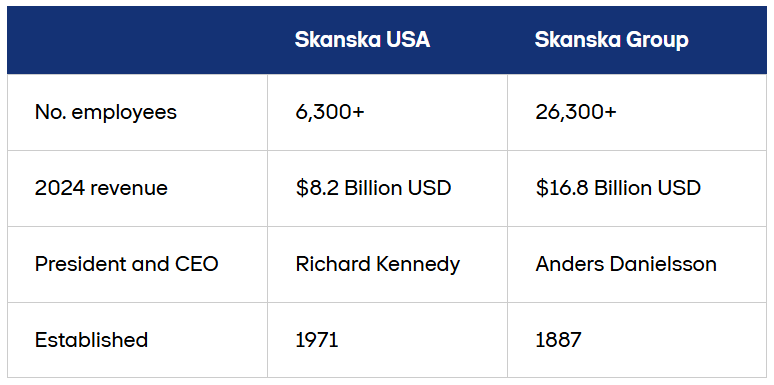
This term paper and presentation provided a comprehensive analysis of Skanska, one of the world's largest construction and project development companies, founded in 1887 and operating across the US, Europe, and beyond. The analysis covered industry context, company financials, competitive positioning, and forward-looking strategy.
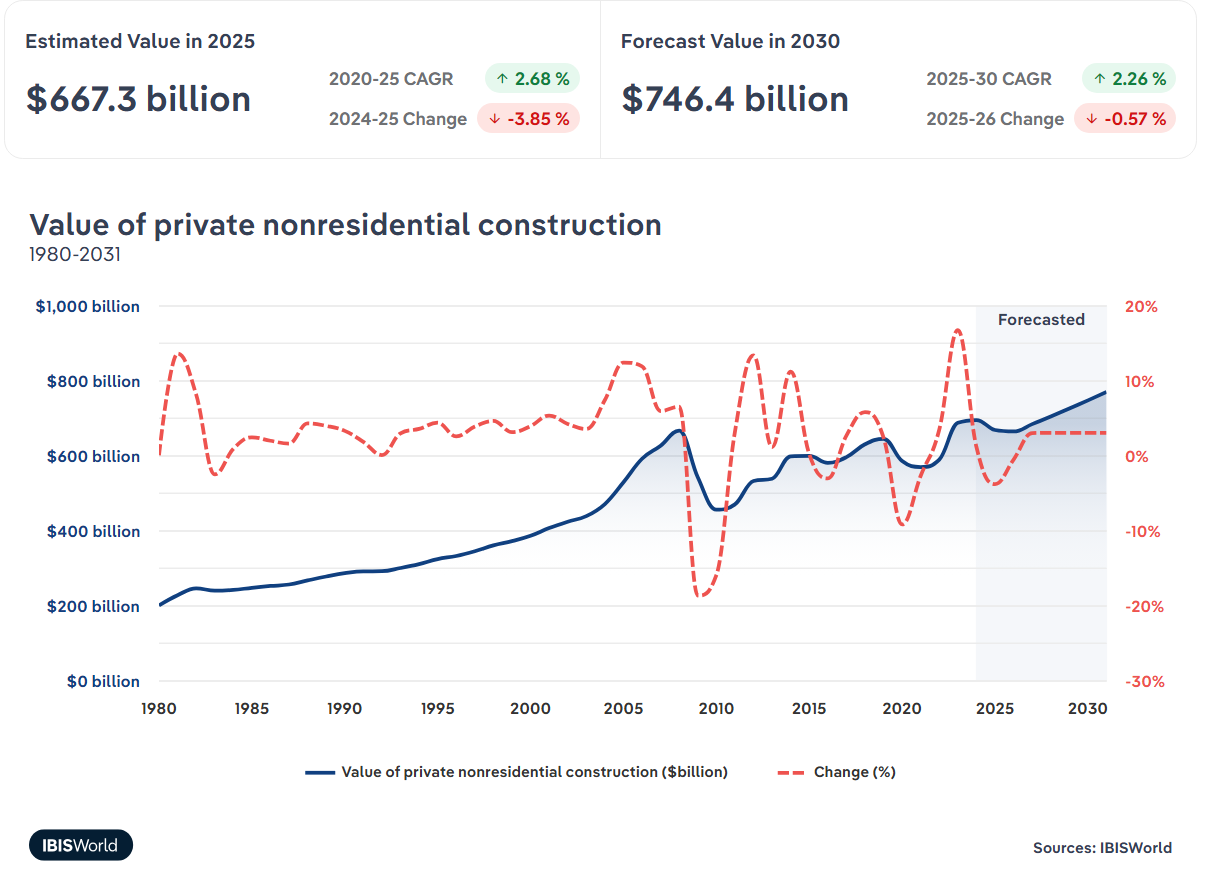
The US construction industry was framed using market data: private nonresidential construction valued at $667.3 billion in 2025 (forecast $746.4B by 2030), residential construction at $763.2 billion, and local/state government investment at $463.6 billion. Within that landscape, Skanska USA generates $8.2 billion in annual revenue with 6,300+ employees, while the Skanska Group reaches $16.8 billion globally with 26,300+ employees.
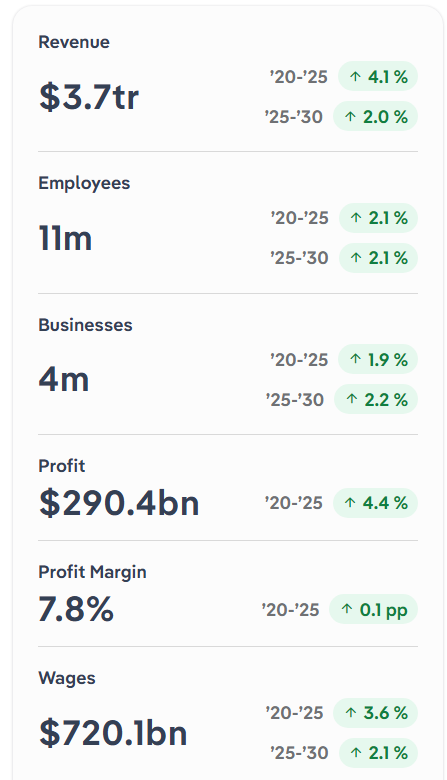
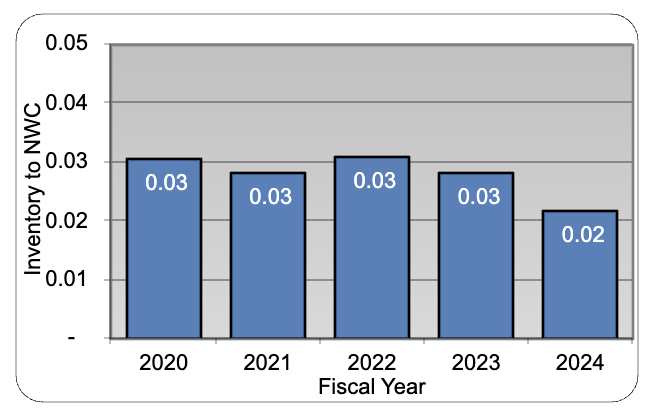
Financial highlights include a 14% profit margin (above sector average), an average wage of $109k (above sector), and wages representing 41.6% of revenue as the largest cost driver. Order backlog and bookings show steady growth through 2025. The paper concluded with a strategy assessment examining Skanska's diversification across construction, residential development, commercial property development, and investment properties.
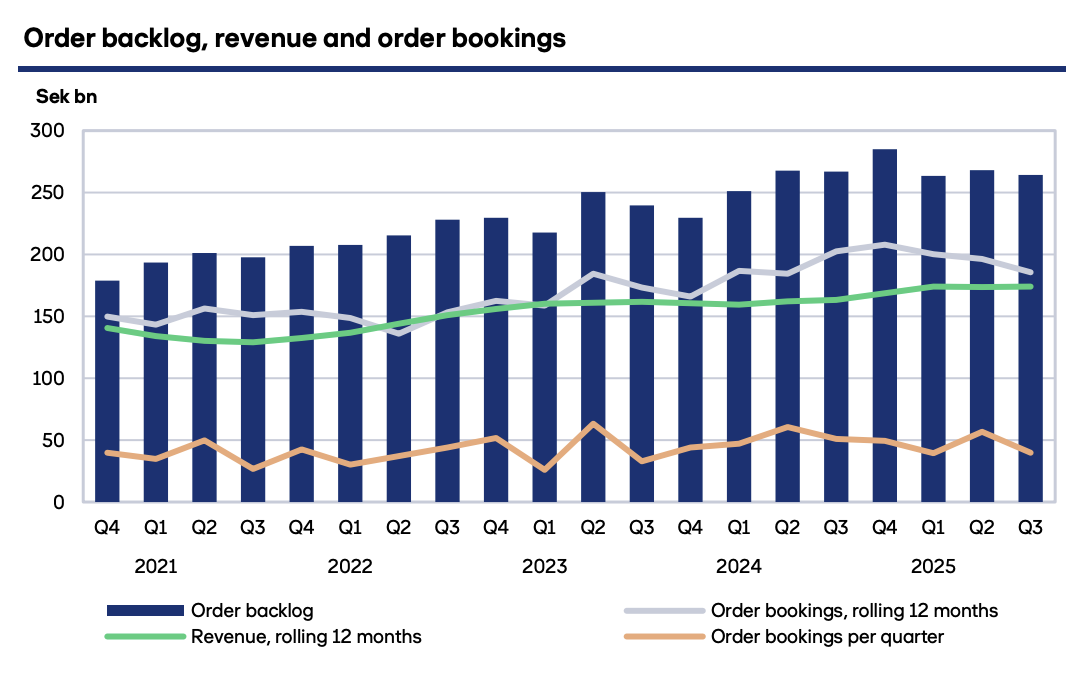
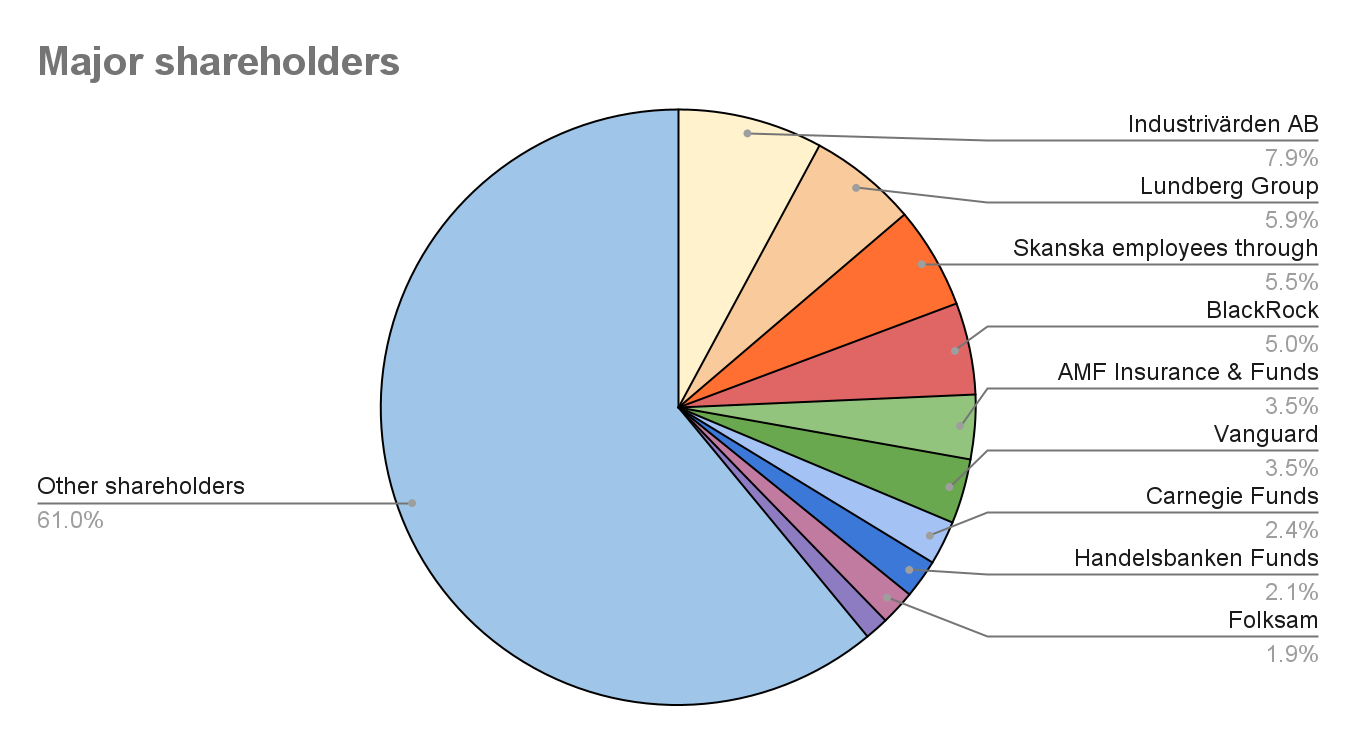
Skanska industry analysis, company profile, and financial data · Click to enlarge
Skanska — Term Paper Final Presentation
CE 502 · Team 2 · Full slide deck with industry analysis, company financials, strategy, and competitive outlook
Homework Case Study · CE 502
Nava Bharat Energy India Limited — Project Finance Case Study
This case study analyzed the project financing structure of Nava Bharat Energy India Limited (NBEIL), a coal-fired power plant in India structured as a Special Purpose Vehicle (SPV) of its parent company, Nava Bharat Ventures Limited (NBVL). The analysis covered the rationale for the SPV structure, the waterfall cash distribution mechanism, and quantitative financial modeling of the project's viability.
Key findings: the SPV structure isolates project risk from NBVL's balance sheet, protecting the parent company's assets while enabling off-balance-sheet financing of a capital-intensive infrastructure project. The waterfall mechanism requires NBEIL to satisfy operating expenses, full debt service, a Debt Service Reserve Account (DSRA) of two quarters of loan payments, and six months of interest before any cash can be distributed to NBVL — ensuring lenders are protected throughout the project lifecycle.
The DSCR was calculated starting from the first operating year (2013), using Cash Flow Available for Debt Service (CFADS). While above the minimum threshold of 1.20x, it fell below the target of 1.50x, indicating moderate financial risk. The IRR of 18% — calculated by solving for the discount rate at which the total project cost equals the sum of discounted free cash flows (PBDIT − Tax) over 15 operating years — falls within the acceptable 15–25% range, confirming the project's financial feasibility. A sensitivity analysis adjusting fuel cost (±10%), plant load factor (±10%), and interest rate (+1%) was performed in Excel to stress-test the base case.
Part 4 — Nava Bharat Homework
Written answers — SPV rationale, waterfall mechanism, DSCR/IRR, sensitivity analysis, project evaluation
Nava Bharat — Completed Financial Model
Excel model — DSCR, IRR, sensitivity analysis on fuel cost, PLF, and interest rate · Presented in class
All Downloads
LEGO Failure Analysis — Team Presentation
Financial statements, ratio analysis, turnaround strategy · Team 2
Skanska Term Paper — Final Presentation
Industry analysis, company financials, strategy · Team 2
Part 4 — Nava Bharat Homework Answers
SPV structure, waterfall, DSCR/IRR, sensitivity analysis, project evaluation
Nava Bharat — Completed Financial Model (Excel)
DSCR, IRR, sensitivity analysis — fuel cost, plant load factor, interest rate